Europe's Housing Crisis

Created by Yutong Zhao and Aidana Oryngaliyeva

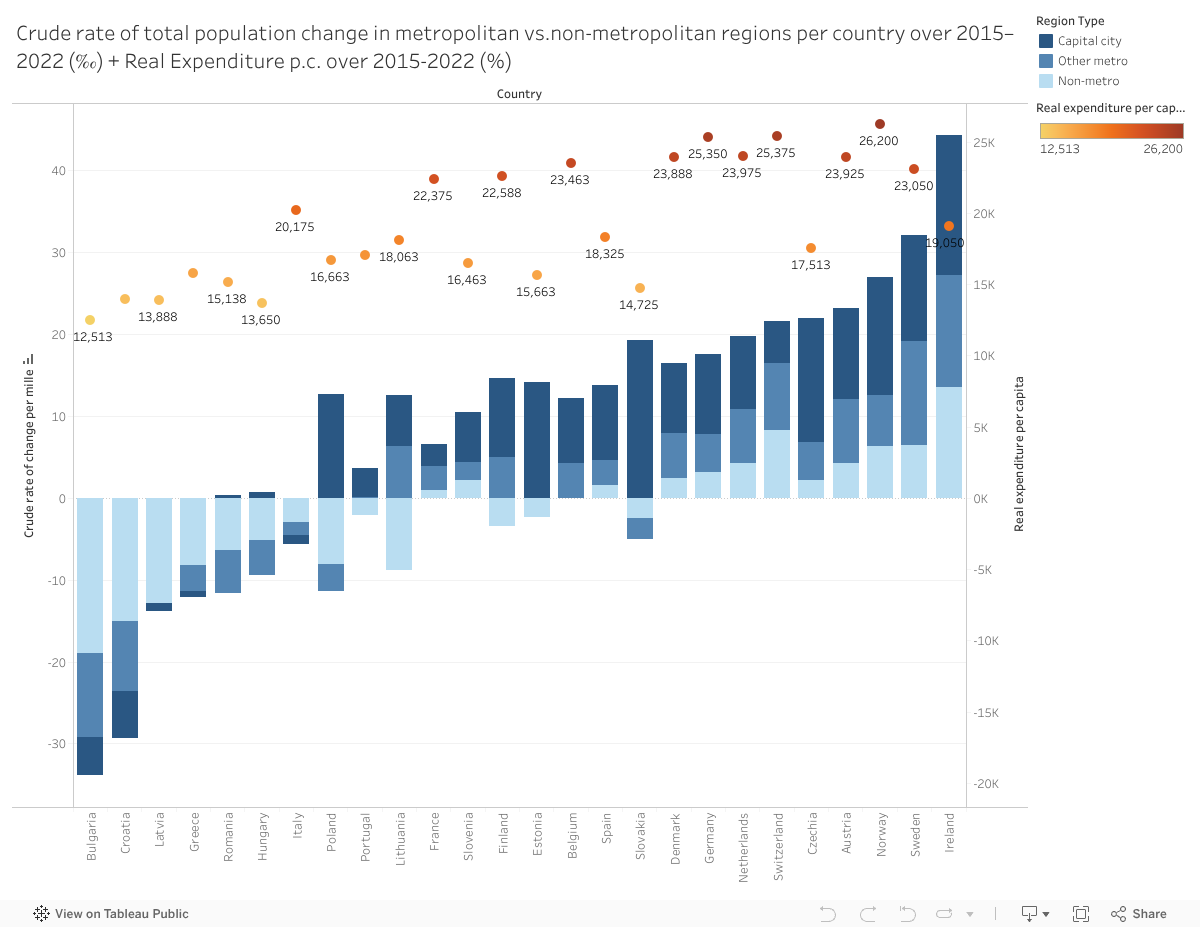
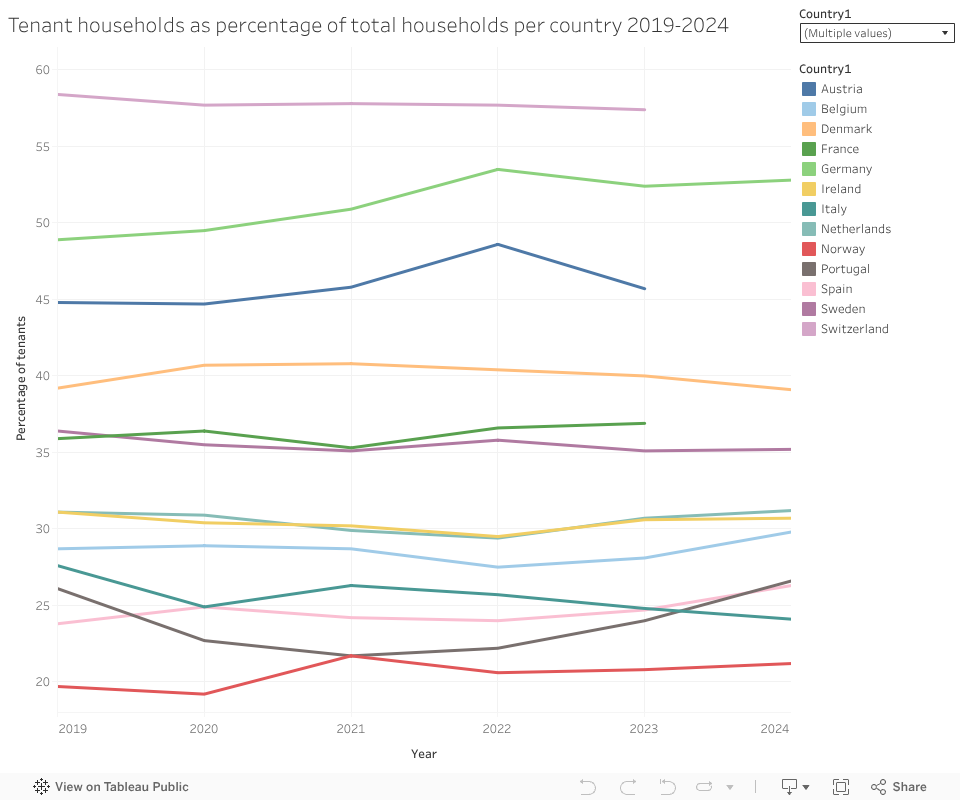
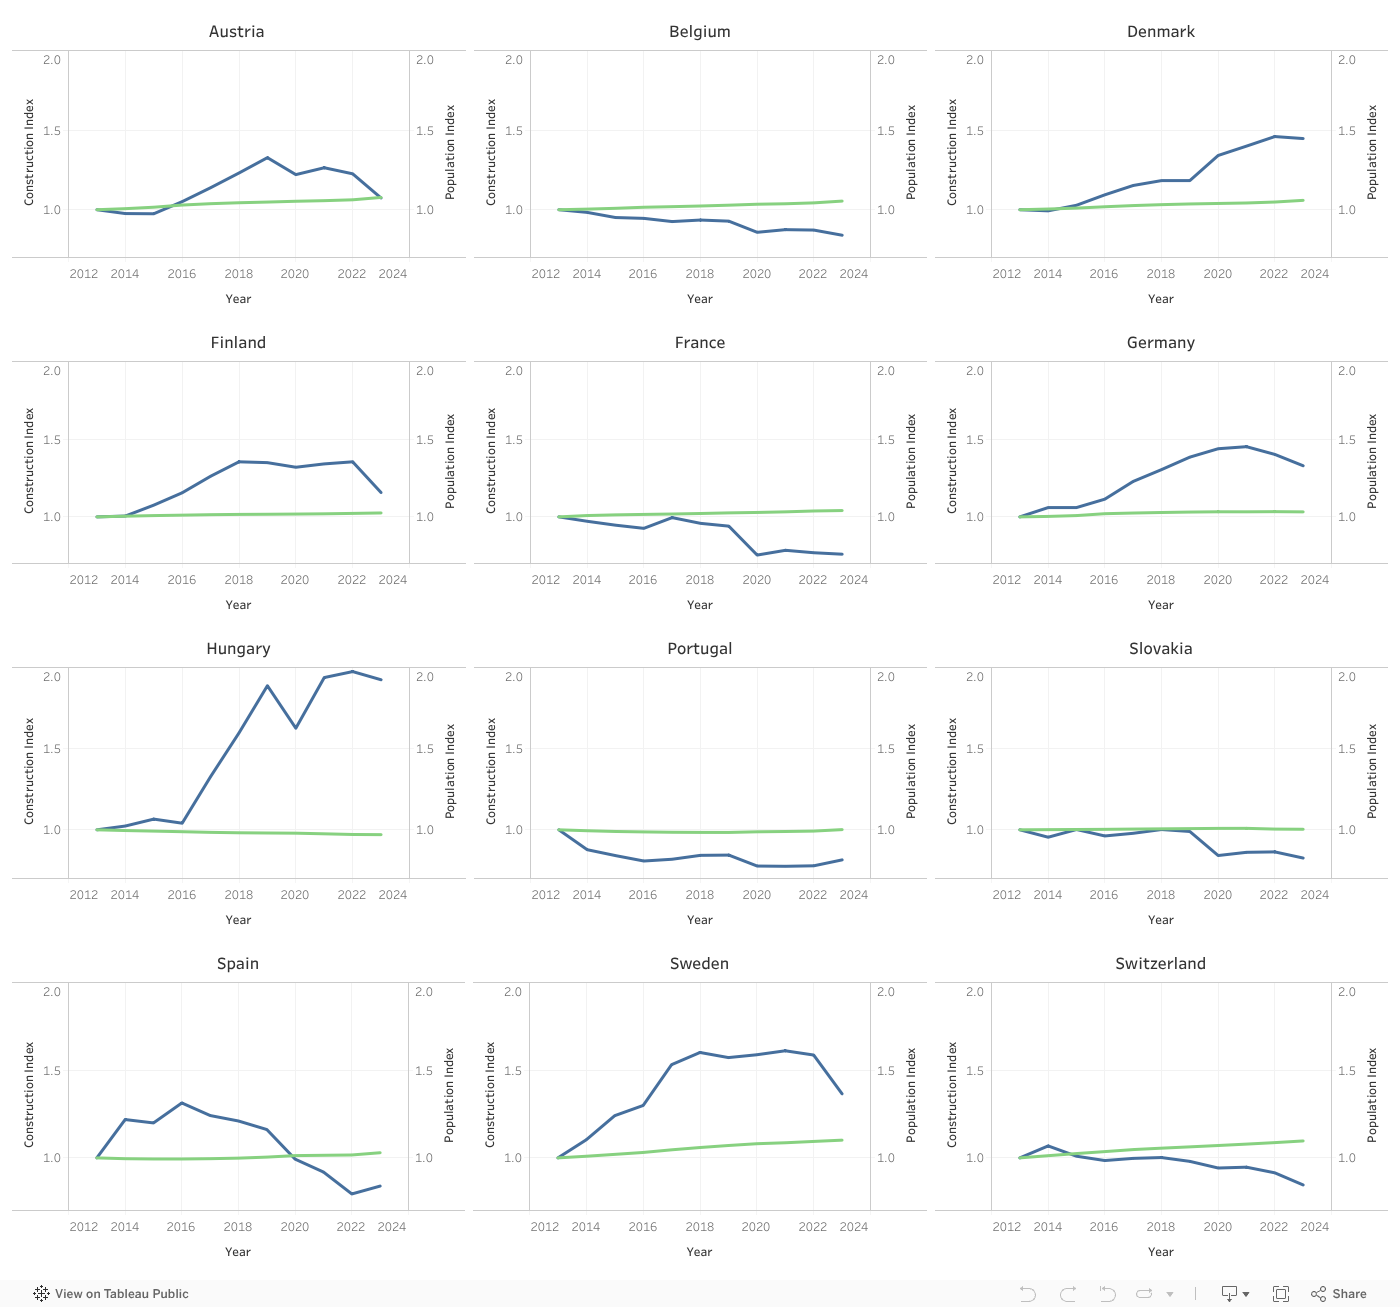
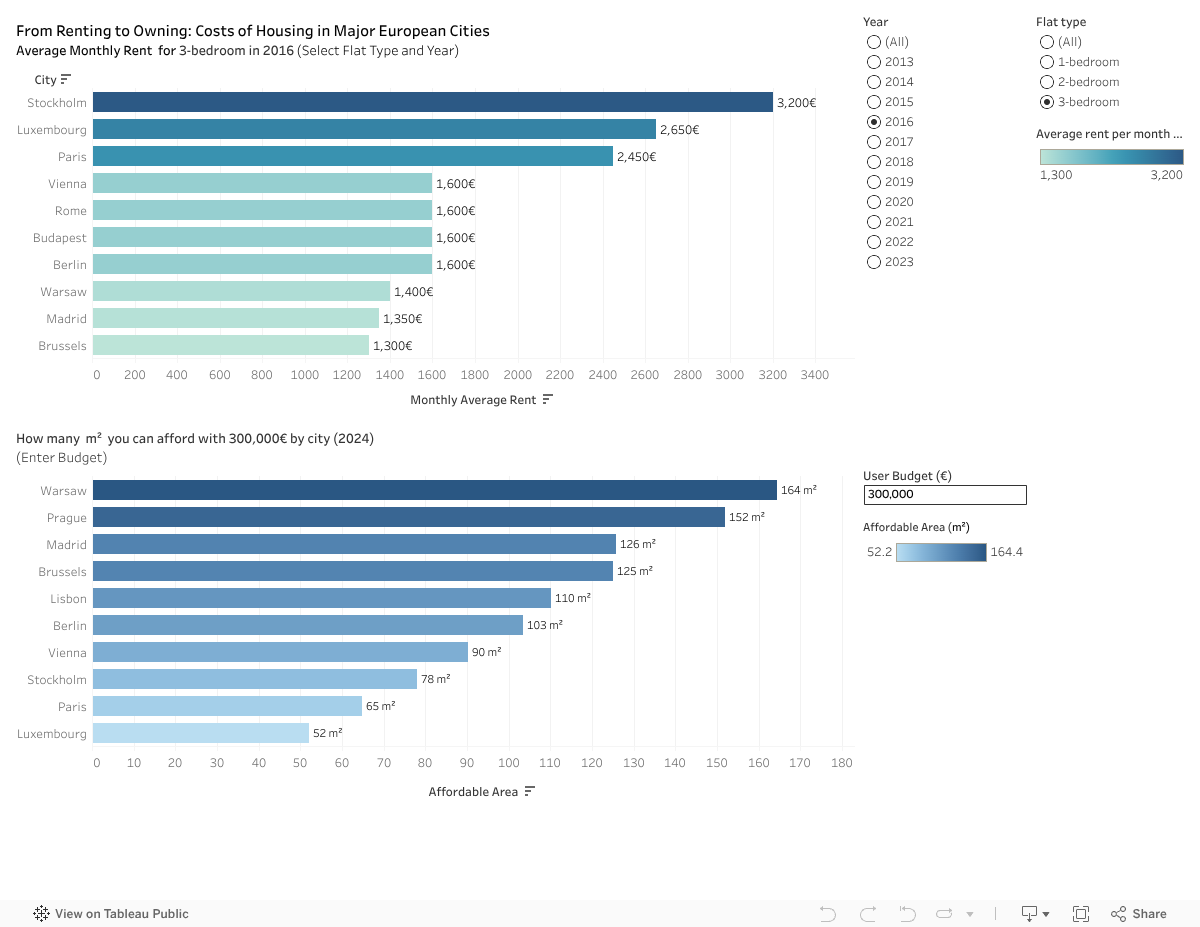
Across Europe, a housing emergency is unfolding. Young professionals can't afford city centers. Families are pushed to the periphery. Entire neighborhoods are transforming beyond recognition.

But what's really driving this crisis? Through six key data visualizations, we'll take you on a journey from macro trends to micro impacts, revealing the complex factors reshaping European cities—and what it means for millions of residents.

Housing Illustration

Chapter 1: The Great Divide

Why some regions thrive while others struggle—population and spending patterns tell the story

The Winners and Losers

Europe is splitting in two. While Northern and Western capitals like Dublin and Stockholm attract new residents, Southern and Eastern regions face an exodus. Metropolitan areas are magnets, while rural communities hollow out.

The money follows the people. Cities with growing populations also see rising expenditure per capita—creating a virtuous cycle for some, a vicious one for others.

Ireland's paradox: Explosive population growth (+15%) but modest spending levels. This mismatch hints at the inequality driving housing pressure—more people, same resources.

Chapter 2: The Status Quo

Despite the crisis, rental markets remain surprisingly stable. Why?

Frozen in Place

Here's the surprising truth: Despite five years of housing turmoil, the split between renters and owners barely budged across Europe. Switzerland stays rental-heavy (60%+), while Eastern Europe remains ownership-dominant.

What this reveals: Housing systems are deeply entrenched. Cultural preferences, financial structures, and policy frameworks create powerful inertia. The crisis isn't changing who rents vs. owns—it's changing how much they pay.

Chapter 3: The Supply Shock

When population growth meets construction chaos—a recipe for crisis

Building at the Wrong Speed

The fundamental problem is clear: Europe is building homes like it's 1995, but people are moving like it's 2025. Construction activity swings wildly—especially in Eastern Europe—while population changes follow steady, predictable patterns.

The result? A structural mismatch. Growing cities can't build fast enough. Shrinking regions build too much. This supply-demand chaos creates the perfect storm for housing shortages and price volatility.

Interactive tip: Hover over the charts to see which countries show the biggest gaps between population growth and construction activity.

Chapter 4: The Price of Place

From studio apartments in Stockholm to family homes in Prague—where your money goes furthest

🏠 The Rental Reality

West = Expensive, East = Affordable. In Stockholm or Luxembourg, a studio costs what a family apartment does in Warsaw. But here's the catch: Eastern European salaries often can't bridge that gap.

💰 The Purchase Power

Your €500K goes 3x further in Prague than Paris. Eastern European cities offer incredible value for buyers—if you can work remotely or have Western savings.

The new European divide: It's not just about North vs. South anymore. It's about whether you can afford to live where you work, or work where you can afford to live.

Chapter 5: The Breaking Point

When housing costs consume life—the cities where residents spend 40%+ of income on rent

🚨 Crisis Level

Brussels & Berlin: 40%+ of income goes to housing—beyond sustainable thresholds

✅ Supply Success

Riga: 587 homes per 1,000 people—proving adequate supply is possible

⚠️ Supply Failure

Madrid: Lowest housing supply with minimal progress—a cautionary tale

The human cost: When housing devours 40% of income, people make impossible choices. Longer commutes. Smaller spaces. Delayed life decisions. Multiple roommates at 35.

Policy matters: Paris maintains relative stability not through market forces, but through intervention. The question is: will other cities follow suit before it's too late?

Chapter 6: The Migration Factor

How population flows reshape rental markets—and why London breaks all the rules

Immigration vs Rent (log-log) Colored by City

Following the People

The pattern is clear: More immigration = higher rents. But the story has fascinating plot twists.

London and Paris are outliers—their rents defy gravity even compared to cities with similar immigration levels. Why? Global capital, financial centers, and policies that treat housing as investment commodities rather than homes.

Meanwhile, Eastern European gems like Zagreb and Ljubljana maintain affordable rents despite varying immigration flows—proving that local economic conditions and supply policies matter as much as demand.

The bottom line: Immigration pressure is real, but smart policy can channel it constructively rather than destructively.

Leuven Housing Crisis: A Public Analysis

Understanding Leuven's Housing Challenge

A comprehensive look at housing affordability, market trends, and community impact in Belgium's historic university city

Welcome to Leuven

Located in the heart of Flanders, Belgium, Leuven is a vibrant university city that blends medieval charm with modern innovation. From just 25 kilometers east of Brussels, the city serves as the capital of the province of Flemish Brabant.

At the center of the city's identity is KU Leuven—one of Europe's oldest and most respected universities. With over 100,000 residents and more than 65,000 students, Leuven thrives as an academic and cultural hub. Its unique atmosphere is shaped by centuries of scholarship, innovation, and youthful energy, making it one of Belgium's most vibrant urban centers.

25 km from Brussels
100K+ residents
65K+ students
Leuven location in Belgium

Leuven's location in Belgium

Housing in Belgium: A Regional Perspective

Before zooming into Leuven, it is important to understand the broader housing landscape of Belgium, the following visualizations outline the trends based on the district and province level between 2010 and 2023.

The following charts show how housing market in Belgium differs between apartments and houses across regions and years. As we can see, there was a consistent rise in housing prices in Belgium, while houses remain more expensive and more frequently transacted than apartments throughout the period from 2010 to 2023.

The following interactive map also provides the regional differences in housing prices and transaction trends across Belgian provinces from 2010 to 2023. According to the map, the provinces surrounding Brussels, particularly Flemish Brabant and Antwerp, exhibit both higher median house prices and higher transaction volumes, indicating strong housing demand in central Belgium.

Now, we will take a closer look at Leuven

+58.8%
Housing price increase since 2015
Now €455K median citywide
21.9%
Households spending >30% income on housing
Above recommended threshold
87.3%
City center residents are renters
University town characteristic
-53%
Drop in new construction permits
Supply constraints since 2020
27%
Employment gap for non-EU residents
vs Belgian background

The Housing Market Reality

How price increases and employment gaps affect different groups

Employment vs Housing Access
Why background matters in Leuven's housing market
The Double Barrier Effect
Belgian residents enjoy 80.3% employment rates, while EU background residents face 64.6% and non-EU immigrants just 53.1%. This 27 percentage point gap between Belgian and non-EU residents creates a double barrier: lower employment rates limit income, which in turn restricts housing options and perpetuates inequality.
Data source: Werkzaamheidsgraad naar herkomst 2022, Gemeente-Stadsmonitor 2023
Housing Market Patterns
Citywide vs City Center comparison
Two Different Housing Markets
The city center shows extreme rental dependence (87.3%) serving mainly students and temporary residents, while the broader city maintains 64.2% homeownership. However, 21.9% of all households face housing cost burden, spending over 30% of income on housing.
Data source: Gemeente-Stadsmonitor 2023 - Housing tenure and affordability data

The Numbers Behind the Crisis

How Leuven's housing market evolved and what drives today's challenges

Price Evolution Since 2015
How much housing prices really increased
€168,500
Price increase since 2015
€550K
Detached house median
€447K
Terraced house median
€274K
Apartment median
The €168,500 Price Shock
The median house price jumped from €286,500 in 2015 to €455,000 in 2024 - an increase of €168,500. This 58.8% price growth far exceeds income growth and explains why homeownership dropped from 70.4% to 64.2% in just six years.
Data source: Statbel housing price statistics 2015-2024
When Building Stops, Prices Soar
The supply crunch that's reshaping Leuven
Half the Building, Double the Pressure
New construction permits crashed from 170 in 2020 to just 80 in 2024 - a 53% drop. Meanwhile, prices kept climbing. This creates a perfect storm: fewer new homes entering the market while demand from students and workers remains high. It's basic economics, but with real human costs.
Data source: Building permit statistics Statbel 2020-2024, price index calculations

The Social Side of Housing Pressure

How housing stress affects community connections and life satisfaction

The Satisfaction Paradox
High satisfaction despite housing pressure
Why People Stay Despite High Costs
Despite 22% of households facing housing cost burden, 85.5% are satisfied with their housing and 90.2% want to stay in Leuven. This suggests the city's quality of life, university atmosphere, and community benefits outweigh financial pressures for many residents.
Data source: Gemeente-Stadsmonitor 2023 - Resident satisfaction surveys
Community Integration Challenges
How housing affects social connections
57.6%
Non-Belgian residents (city center)
28.1%
Gap in neighbor interaction
91.7%
Small households (1-2 people)
15.4%
May leave Leuven entirely
Housing Instability Affects Social Bonds
Belgian residents interact with neighbors 84% of the time vs. 55.9% for non-Belgian residents. Combined with housing pressure, this creates social fragmentation. When people can't afford stable housing, building lasting community connections becomes much harder.
Data source: Gemeente-Stadsmonitor 2023 - Social cohesion indicators

Resident Satisfaction Priority Map – Leuven Housing (2023)

This chart ranks housing indicators by resident satisfaction. Comparing satisfaction levels with coverage highlights which features matter most—and where coverage may fall short.

What This Means for Leuven

Key insights and implications from the data

Employment Discrimination Impact
Non-EU immigrants face both employment barriers (53.1% vs 80.3% employment rate) and housing challenges. This 27 percentage point gap creates a double disadvantage, where lower employment rates limit housing options and perpetuate inequality.
Solution needed: Coordinated employment support and anti-discrimination housing policies.
The €168,500 Price Barrier
Housing prices rose €168,500 since 2015, representing a 58.8% increase that far exceeds income growth. This price explosion has contributed to the 6.2 percentage point drop in homeownership rates over six years.
Solution needed: Increase affordable housing supply and support first-time buyer programs.
Supply Shortage Crisis
New construction permits collapsed 53% from 170 to 80 annually while demand remained high. This supply-demand imbalance is the primary driver of price increases and housing scarcity across all income levels.
Solution needed: Streamline building approvals and incentivize affordable housing development.
Social Fragmentation Risk
Housing pressure creates social division with a 28.1% gap in neighbor interaction between Belgian and non-Belgian residents. Unstable housing prevents community building and social cohesion.
Solution needed: Housing policy must include community integration support and stable tenure options.
Quality vs Affordability
Leuven's high-quality infrastructure (97.6% internet, 93.6% central heating) and university town benefits create strong satisfaction despite cost burdens. This suggests targeted affordability solutions rather than compromising quality.
Solution needed: Maintain quality while expanding affordable options through smart planning and subsidies.

Understanding Leads to Solutions

By analyzing real data and resident experiences, we can work together toward a Leuven where everyone has access to quality, affordable housing while maintaining the vibrant, diverse community that makes this historic university city special.

View Source Data
Data Sources & Methodology
Transparent, evidence-based analysis for public understanding
Housing Market Data
Statbel | provincies.incijfers.be
2015-2024 housing prices, transaction volumes
Construction Activity
Building permit statistics | Statbel
2020-2024 new construction, renovation permits
Resident Survey
Gemeente-Stadsmonitor 2023
Housing conditions and satisfaction surveys
Employment Data
Werkzaamheidsgraad naar herkomst 2022
Employment rates by background
Social Integration
Gemeente-Stadsmonitor 2023
Community relations and neighbor interaction
Housing Quality
Gemeente-Stadsmonitor 2023
Infrastructure and amenity coverage data

Analysis Period: 2015-2024 | Survey Data: 2008-2023 | Geographic Scope: Leuven city & city center | Completed: June 2025